Monetization | Trading View
What is TradingView?
TradingView is a financial visualization and charting platform that provides traders and investors with advanced tools to analyze financial markets. It supports multiple asset classes, including stocks, forex, cryptocurrencies, commodities, and indices. Both retail and professional traders widely use the platform for market research, technical analysis, and social trading.
Core Value Proposition of TradingView:
- Advanced Charting Tools: Offers interactive and customizable charts with a wide range of technical indicators.
- Real-Time Market Data: Provides access to live price data and market trends across multiple financial instruments.
- Social Trading Community: Users can share their market insights, publish trade ideas, and follow top traders.
- Cloud-Based Accessibility: Can be accessed from any device with internet connectivity without the need for software installation.
- Integration with Brokers: Allows users to trade directly through integrated brokerage accounts.
- Custom Scripting via Pine Script: Enables traders to develop custom indicators, strategies, and alerts.
- Multi-Asset Support: Covers multiple financial markets, making it useful for traders with diverse portfolios.
Key Features of TradingView:
- Interactive Charts:
- Multiple timeframes (from seconds to years).
- Over 100+ built-in technical indicators.
- Drawing tools like trendlines, Fibonacci retracements, and patterns.
- Market Data & Alerts:
- Real-time and historical price data.
- Customizable alerts based on price levels, indicators, or trend patterns.
- Social & Community Features:
- Users can publish trade ideas and interact with others.
- Community-driven insights and market sentiment analysis.
- Screeners for Stocks, Forex, and Crypto:
- Allows filtering assets based on various parameters like volume, RSI, and moving averages.
- Broker Integration & Paper Trading:
- Direct integration with trading brokers for executing trades.
- Paper trading mode for practice without real money.
- Mobile & Web-Based Platform:
- Available on desktop, web, and mobile apps (iOS & Android).
- Pine Script for Custom Indicators:
- Enables traders to code their own indicators and strategies.
Who is an Active User for TradingView?
Definition:
An active user on TradingView is someone who has realized the core value proposition of the product at least once by actively engaging with its tools whether it’s using an advanced chart, setting up alerts, or engaging with the community for market insights.
Primary Activation Metric:
“User has created or interacted with at least one customized trading setup that enhances their decision-making within 7 days of creating a account.”
Why This Metric Works?
- It moves beyond passive usage. Just logging in or browsing doesn’t mean a user has experienced value. This metric ensures they’ve actively customized something or made an informed decision.
- It differentiates between potential users and real active users. Many sign up out of curiosity, but only those who set up indicators, alerts, or trading layouts are likely to stick around.
- It reflects core product value. TradingView’s USP lies in charting, customization, and engagement. If a user hasn’t used at least one of these, they haven’t truly experienced its power.
Final Thought:
An active TradingView user is someone who has used at least one of its core analytical or trading tools to enhance their decision-making. The activation moment happens when a user customizes a trading setup, sets alerts, or engages with the platform’s interactive features.
Ideal Customer Profile (ICP) Deep Dive:
ICP | ICP 1 | ICP 2 | ICP 3 | ICP 4 |
|---|---|---|---|---|
Parameter / Context | Free User (Retail Trader & Investor) | Active Retail Trader (Swing & Intraday) | Professional Trader & Investor | Market Educator & Content Creator |
Persona | Retail trader who maximizes free features | Trades regularly and needs better real-time data | Full-time trader or wealth manager | Traders who educate and create content |
Segmentation | Casual User | Core User | Core User | Power User |
Age | 22-35 | 25-45 | 30-55 | 28-50 |
Occupation | Aspiring traders, working professionals, college students | IT professionals, bankers, self-employed individuals | Full-time traders, portfolio managers, proprietary traders | Trading educators, YouTubers, influencers |
Trading Experience | Beginner to intermediate | Intermediate to advanced | Advanced (5+ years) | Intermediate to advanced |
Market Interest | Stocks, cryptocurrencies, options | Equities, forex, commodities, options | Stocks, forex, commodities, indices, options, futures | Stocks, forex, crypto, commodities |
Budget | ₹0 (prefers free resources) | ₹500-₹2000 per month | ₹2000-₹5000 per month | ₹1500-₹4000 per month |
Primary Goal | Learn trading, analyze charts, follow market trends | Execute better trades with technical analysis | Optimize trading strategies & execution | Create content, teach trading, engage audience |
Preferred Trading Style | Swing trading, positional trading | Intraday, swing trading | Algorithmic, options, futures trading | Long-term investing, swing trading |
Time Spent on TradingView (Daily) | 30-60 minutes | 1-3 hours | 4-8 hours | 2-4 hours |
Most Used Features | Basic charting, free indicators, community ideas | Multiple chart layouts, alerts, custom indicators | Pine Script, advanced backtesting, multi-screen setup | Chart publishing, trade idea sharing, video overlays |
Biggest Pain Point | Delayed market data, limited saved layouts | Delayed alerts, limitations in real-time data | Broker API integration, historical data limitations | Limited branding, exposure in TradingView community |
Alternative Platforms Considered | Zerodha Kite, Investing.com, Moneycontrol | MetaTrader, ThinkorSwim, Upstox Pro | Bloomberg Terminal, MetaTrader, Trading Technologies | Investing.com, YouTube, Discord Trading Groups |
Decision-Making Factor for Premium Plan | Affordable pricing, more alerts & layouts | Real-time data, custom indicators, advanced alerts | API access, ultra-low latency data, advanced scripting | Increased visibility, branding tools, premium publishing options |
Likelihood to Upgrade (Low/Medium/High) | Low | Medium | High | Medium to High |
User Segmentation
For TradingView, users vary significantly in their level of engagement—some may log in occasionally to check market trends, while others rely on the platform daily for critical trading decisions. By segmenting users based on behavior (Casual, Core, Power Users), we can personalize pricing, upsell relevant features, and optimize retention strategies.
Segmentation | Features Used | Natural Frequency |
|---|---|---|
Casual Users | Basic charting, free indicators, community trade ideas | 1-3 times a week (Occasionally) |
Core Users | Multiple chart layouts, alerts, and custom Scripts. | Multiple times a week (Regularly) |
Power Users | Pine Script, advanced back testing, multi-screen setup. | Multiple times a day (Heavily) |
Litmus Test For Monetization:
For Litmus test in Monetization - We will look into 3 Factors
1: Retention Curve
2: Depth of Engagement
3: Willingness to Pay
Retention Curve Analysis
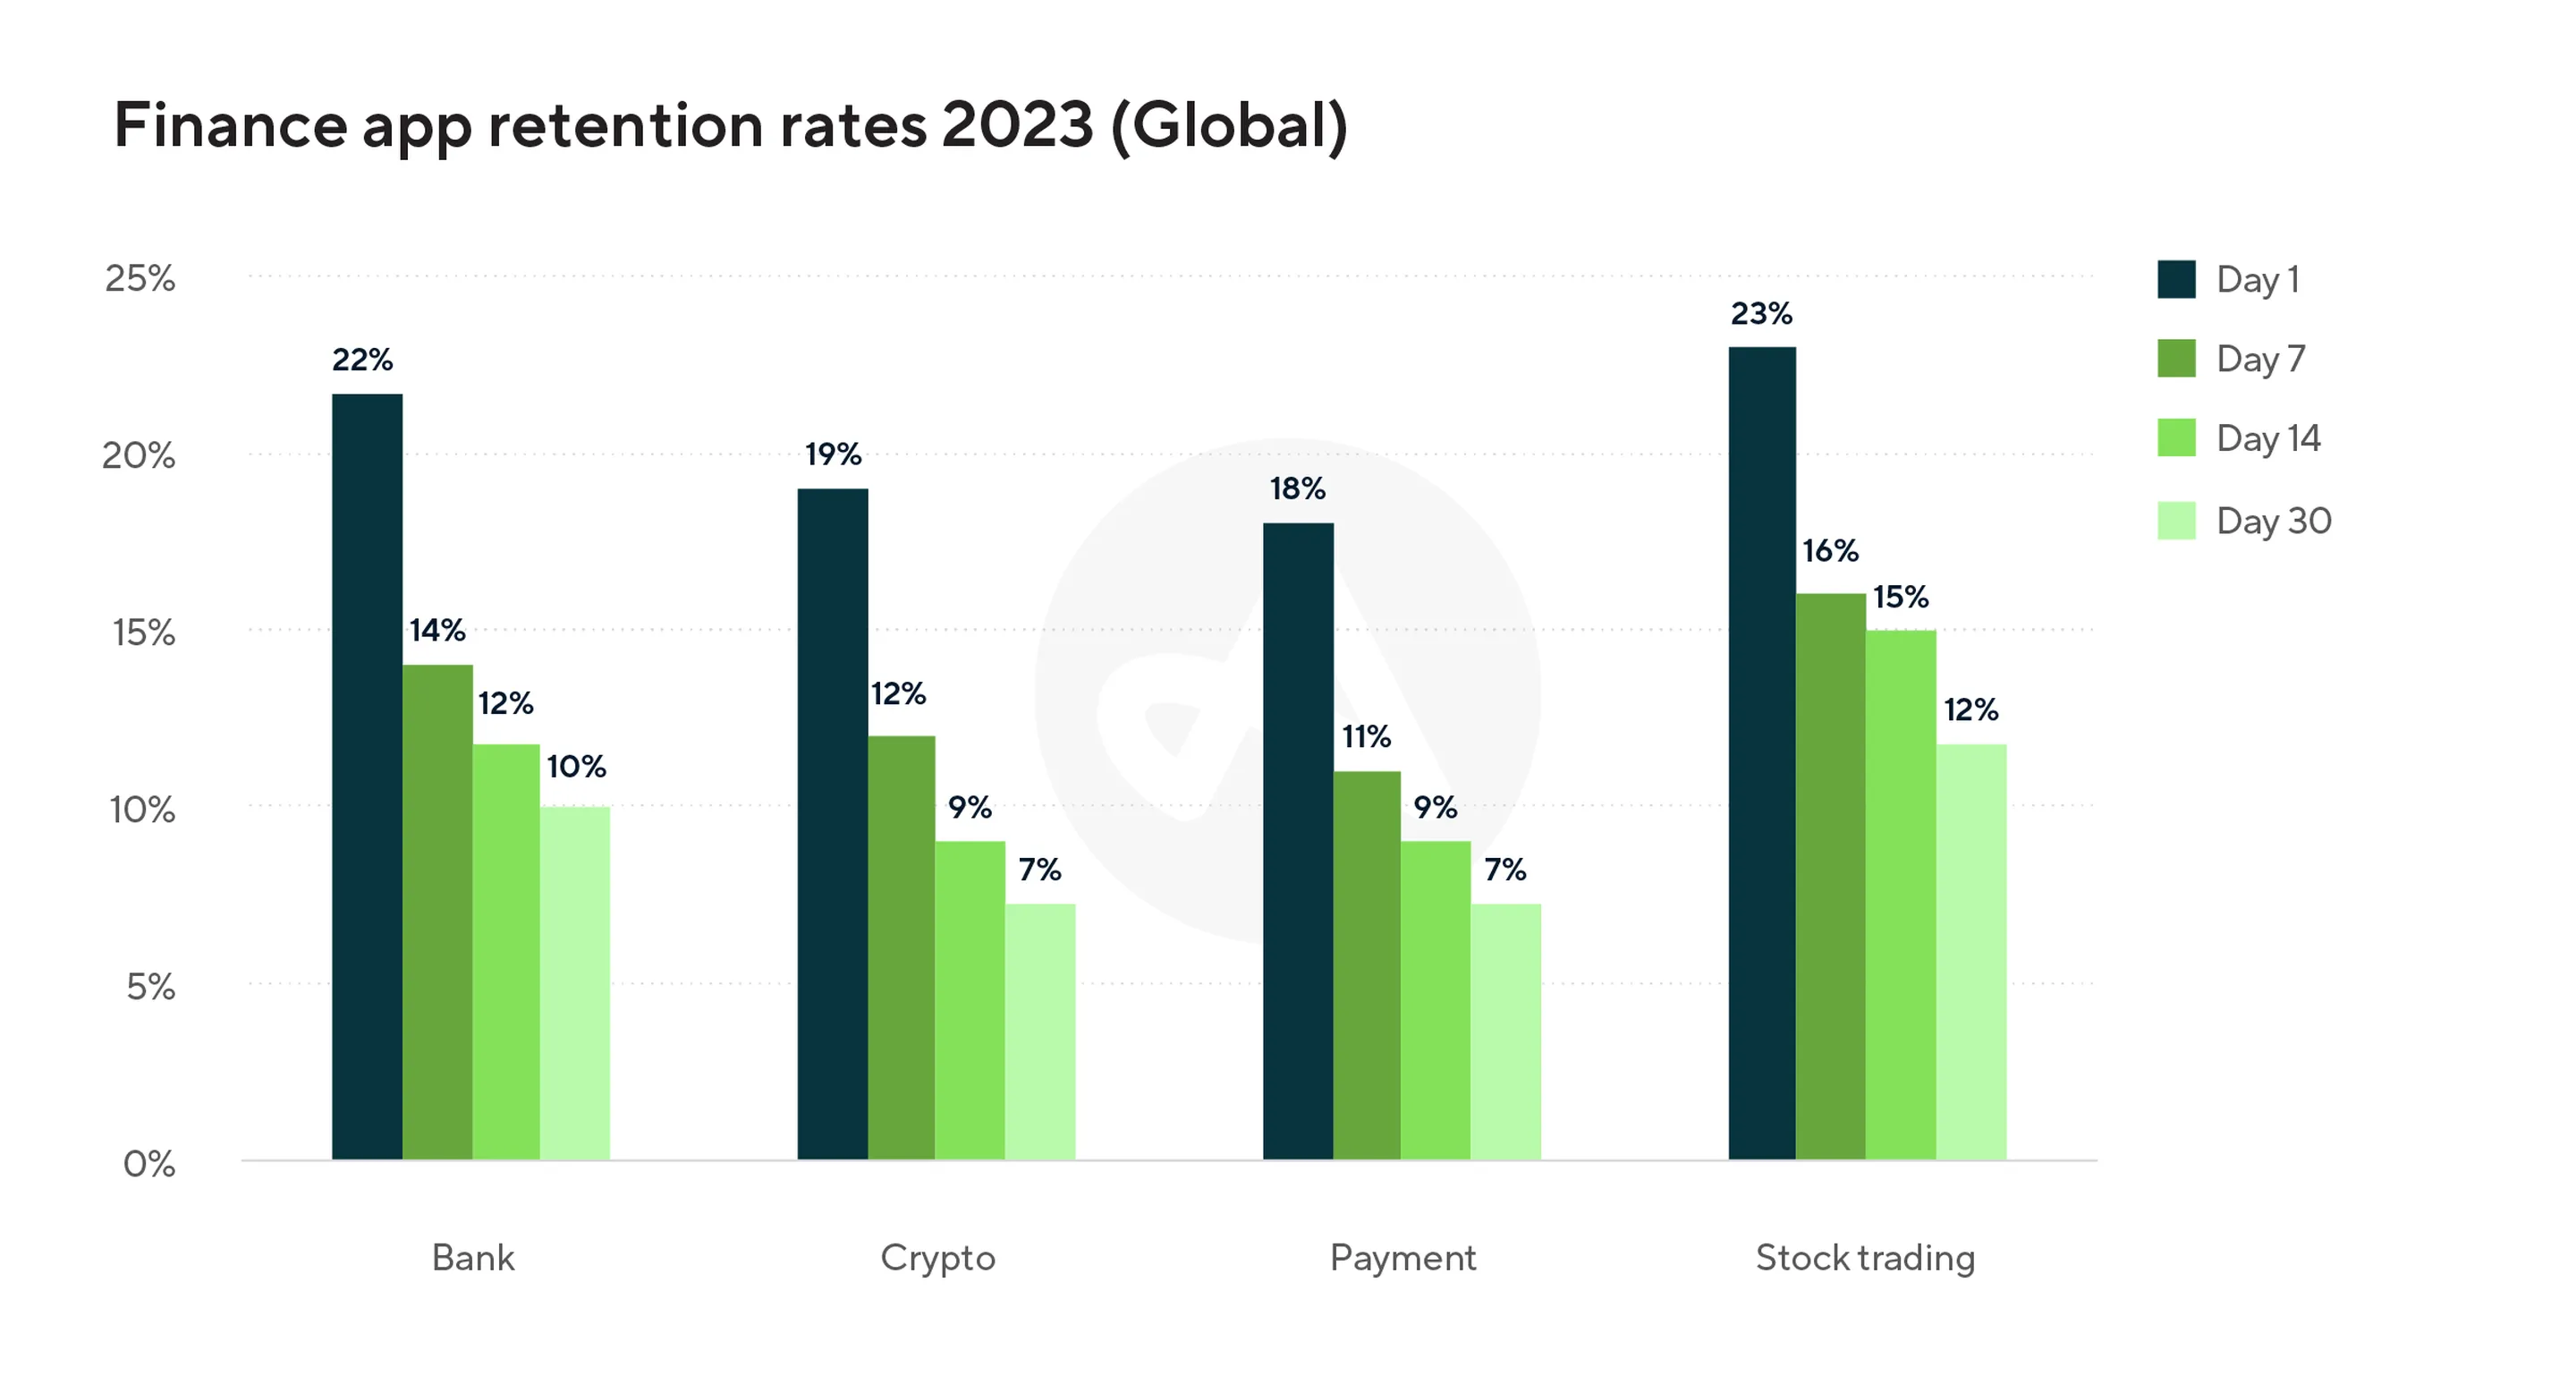
While specific retention rates for TradingView are not publicly disclosed, we can infer potential benchmarks by examining industry standards. Based on industry benchmarks and the finance app retention data from Adjust (Refer to the below Image) , we can estimate that TradingView’s 30-day retention rate is approximately 12%. This assumption is derived from the stock trading category in the provided chart, which shows that similar financial tools see a gradual drop-off in user engagement over time.
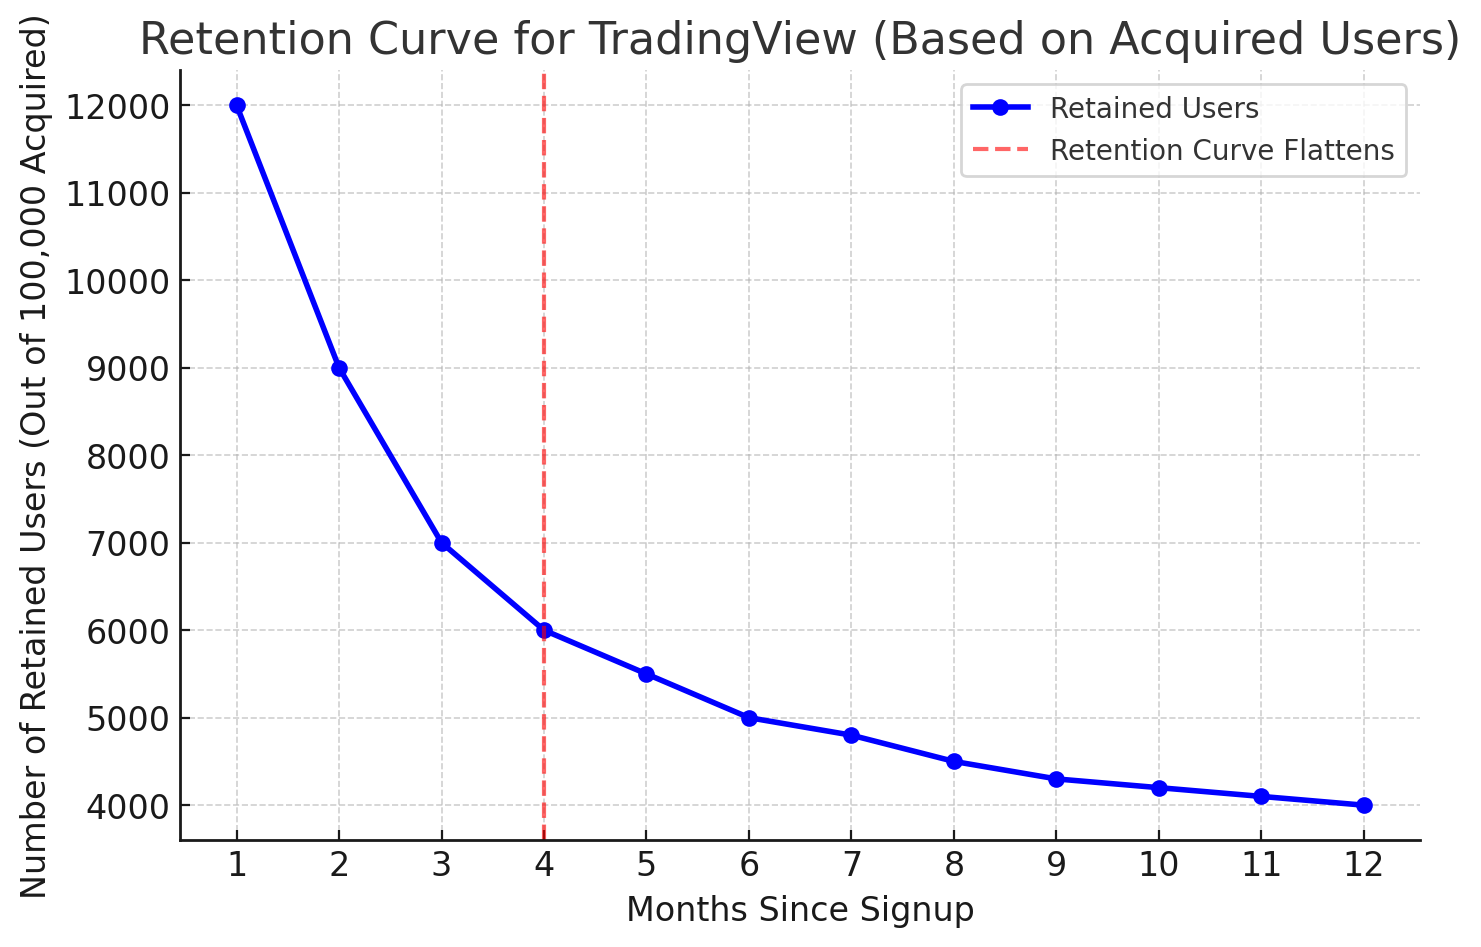
For the above assumptions - Let's have a look at Retention curve for TradingView
Why is Retention Relatively Low for an App Like TradingView?
- Many Users Are Casual Traders – A significant portion of TradingView’s audience consists of retail traders and hobbyists who might log in sporadically rather than daily. Unlike brokerage platforms, TradingView is not mandatory for executing trades, which reduces the need for daily engagement.
- Lack of Forced Habit Formation – Unlike apps like Zerodha, where users must log in to place trades, TradingView serves as an optional research tool. If users don't actively trade or invest regularly, they have no strong reason to return daily.
- Users Rely on Multiple Platforms – Many traders use a mix of broker apps, news websites, and other charting tools, meaning TradingView is not always the single source of truth for market research.
- Freemium Users Drop Off Over Time – Since TradingView has a free tier, many users sign up, explore the platform, but never fully commit to using advanced features, leading to churn over time.
Depth of Engagement
Before we get into Depth of Engagement - Let's analyze the primary framework for Engagement
Primary Metric → Frequency
- Since TradingView is a trading analysis tool, retention is strongly linked to how frequently users need to analyze markets.
- If users don't return frequently, their likelihood of churn increases.
- Natural Frequency Matters: A long-term investor may use TradingView once a week, whereas an intraday trader needs it multiple times a day.
- Key Activation Metric: A user should return at least 15-20 times within the first 30 days to be considered engaged.
How to Measure Deeper Engagement in TradingView?
- Session Depth → How many tools does a user interact with per visit?
- Example: Just opening a chart vs. using multiple indicators, alerts, and saving layouts.
- Feature Stickiness → Which features drive repeat engagement?
- Example: Users who set custom alerts are more likely to return than those who don’t.
- Community Interaction → Are users engaging beyond their own trades?
- Example: Commenting on others' ideas, following top traders, or publishing their own ideas.
User Type | Primary Engagement Behavior | Time Spent Per Session | Number of Features Used Per Session | Key Engagement Actions | Likelihood to Convert to Paid User | Friction Points (Why They Drop Off) |
|---|---|---|---|---|---|---|
Casual User | Logs in occasionally, checks charts but doesn’t set alerts or engage deeply. | 5-10 minutes per session | Basic charting, occasional indicators. | Checks stock trends, reads market news, may view trade ideas. | Low | No strong habit formation, finds free version enough. |
Core User | Uses TradingView daily, relies on alerts, multiple chart layouts, technical indicators. | 20-40 minutes per session | Uses multiple indicators, alerts, layouts, community ideas. | Sets price alerts, saves chart layouts, engages with trade ideas. | Medium to High | Needs more real-time data, wants better integration with trading accounts. |
Power User | Uses TradingView as their primary trading tool, deeply customizes charts and scripts. | 60+ minutes per session | Advanced scripting, broker API, multi-screen charting. | Creates Pine Script indicators, integrates with broker API, shares insights. | Very High | Requires institutional-grade speed, more automation, better customer support. |
Willingness To Pay
Users will be willing to pay for TradingView when:
- They experience significant value beyond the free version.
- They have a strong use case that requires premium features.
- The perceived benefits outweigh the cost.
User Type | Willingness to Pay | Reasoning | Key Features They Would Pay For | Expected Pricing Sweet Spot (₹ per month) |
|---|---|---|---|---|
Casual User | Low | Prefers free features, trades occasionally, does not see enough value in premium tools. | Limited—might pay for ad-free experience or occasional premium access. | ₹0 - ₹500 |
Core User | Medium to High | Trades regularly, needs real-time data, alerts, and saved layouts to improve trading efficiency. | Real-time data, custom alerts, multiple chart layouts, Pine Script customization. | ₹1000 - ₹2500 |
Power User | Very High | Uses TradingView as a core tool, requires scripting, broker integrations, and full data access. | Broker API integrations, deep historical data, unlimited scripting, premium support. | ₹2500 - ₹5000+ |
Take Aways:
- Casual Users → Might pay for ad-free experience & occasional premium access.
- Core Users → Will pay for real-time data, alerts, and advanced charting tools.
- Power Users → Will Pay for API integrations, deep historical data, and institutional-level tools
Does TradingView Pass the Litmus Test?
1️⃣ Retention: Do Users Keep Coming Back? ✅
👉 Reasoning:
- TradingView has strong retention among Core & Power Users (daily traders, technical analysts).
- High natural frequency → Users check charts, set alerts, and track markets multiple times a day.
- Retention curve flattens after 4-6 months, meaning long-term users stay engaged.
2️⃣ Deeper Engagement: Are Users Actively Using the Product? ✅
👉 Reasoning:
- Power users deeply engage with TradingView’s charting, indicators, alerts, and Pine Script automation.
- Core users spend 20-40 minutes per session, actively setting up trading strategies.
- Community engagement (publishing trade ideas, following other traders) creates additional stickiness.
3️⃣ Willingness to Pay: Are Users Ready to Pay? ✅
👉 Reasoning :
- Power Users & Active Traders are willing to pay for real-time data, advanced indicators, and broker integrations.
- Casual Users are hesitant to pay but could convert via pay-per-use or feature-based upsells.
- Institutional traders & financial firms see TradingView as a core tool and are likely to pay for access-based pricing (API, data feeds, multi-user plans).
What Problems Is TradingView Solving?
| Category | User Pain Point / Problem | Why It’s a Problem? |
|---|---|---|
Limited Charting Capabilities | Broker-provided charts (Zerodha, Upstox) have limited tools, fewer indicators, and poor UI. | Traders need better visualizations for accurate decision-making. |
Lack of Real-Time Market Data | Free tools (Investing.com, Yahoo Finance) provide delayed data. | Intraday & swing traders need instant price updates for precise entries/exits. |
Scattered Trading Workflow | Traders switch between multiple tools—charts, alerts, news, community insights —across different platforms. | Leads to inefficiency, missed trades, and poor decision-making |
No Personalization & Automation | Default settings don’t allow deep customization. Most tools don’t support custom scripts & alerts | Professional traders & algo traders need tailored setups. |
Lack of Trade Validation & Learning | No easy way to backtest strategies or validate technical analysis. | Traders can’t improve or learn from past mistakes effectively |
No Social Trading Community | Most tools don’t offer collaborative learning or trade idea sharing. | New traders lack mentorship while experts can’t showcase credibility. |
How is it Solving?
TradingView stands out because it solves multiple pain points under one platform. Here’s how:
| Core Value Proposition | Problem It Solves | Outcomes for Users |
|---|---|---|
Advanced & Intuitive Charting | Eliminates the limited UI & tools of broker-based charts | Faster, clearer technical analysis → Better trade accuracy. |
Real-Time Market Data (Premium Feature) | Solves delayed price updates in free tools | Never miss a trading opportunity → Improved execution. |
All-in-One Trading Platform | Removes scattered workflow across multiple apps | Saves time switching between apps → More efficiency. |
Custom Alerts & Pine Script Automation | Replaces manual monitoring with smart automation | Less manual work → Smarter trading, better risk management. |
Back testing & Strategy Testing | Fixes the lack of trade validation tools | Less manual work → Smarter trading, better risk management. |
Social Trading & Community Insights | Adds a collaborative learning ecosystem for traders. | Better learning, access to expert insights → More confidence in trades. |
Key Takeaway
TradingView’s strength isn’t just that it’s a charting platform—it’s that it solves inefficiencies across the entire trading workflow.
✅ For casual traders → Makes trading easy & accessible.
✅ For core traders → Enhances decision-making with data, alerts, & automation.
✅ For professional traders → Provides institutional-grade customization & execution tools.
If Not TradingView, How Are Customers Getting Their Desired Outcomes?
If users don’t use TradingView, they still have alternative ways to achieve their goals of technical analysis, market tracking, and trade execution. Based on different user segments, they would:
| User Type | Alternative Ways to Get Their Desired Outcome |
|---|---|
Casual Users | Use free broker-provided charting tools (Zerodha Kite, Upstox, Angel One). |
Core Users | Use MetaTrader (MT4/MT5), Investing.com for advanced charting. |
Power Users | Use Bloomberg Terminal, Trading Technologies, Python-based back testing tools. |
While substitutes exist, most lack the combination of real-time data, advanced tools, and community insights that TradingView offers.
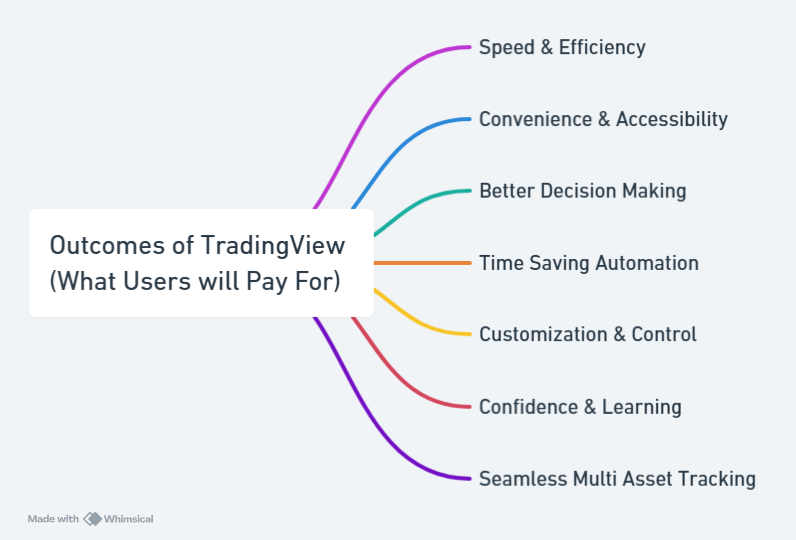
What Are Users Paying for in TradingView?
Users don’t just pay for charting—they pay for speed, accuracy, confidence, and time savings in their trading journey.
Monetization design
TradingView has two approaches to decide who to charge:
- Casual, Core, and Power Users Approach
- Charge Core and Power users first, as they gain the most value from premium features.
- Casual users should remain on freemium until they show signs of deeper engagement.
- Risk of charging Casual users too early? High churn and drop-off, as they don’t yet see enough value.
- RFM (Recency, Frequency, Monetary) Grid Approach
- Recency: How recently has the user engaged? More recent = more likely to convert.
- Frequency: How often do they use TradingView? High frequency users are more monetizable.
- Monetary: Have they spent before? If yes, higher chance of upgrading further.
Which Strategy is Better for TradingView?
✅ Best Approach: Hybrid of Both (Casual/Core/Power + RFM Segmentation)
We start with Core and Power users but use RFM analysis to identify the best moment to upsell them.
| User Segment | Monetization Approach |
|---|---|
Casual Users (Low Recency, Low Frequency, Low Monetary) | Keep them on freemium, provide occasional monetization nudges via market alerts or feature teasers. |
Core Users (Medium to High Recency & Frequency, Low Monetary) | Target them with subscription-based monetization (Pro/Pro+ plans). Focus on real-time data, alerts, multi-layouts. |
Power Users (High Recency, High Frequency, Medium to High Monetary) | Push premium monetization (Pro+ & API integrations), offer institutional-level features & pricing tiers. |
Price Elasticity for Different User Segments
| User Type | Recency (How Recently Used?) | Frequency (How Often Used?) | Monetary (Willingness to Pay?) | Expected Churn Rate if Charged | Expected Revenue Gain |
|---|---|---|---|---|---|
Casual Users | Low (Occasionally uses TradingView) | Low (Few times per month) | Low (Relies on free version) | High churn (50-70%) → Not ready to pay yet | Minimal (Might pay for one-time features like day access to premium) |
Core Users | Medium (Uses TradingView regularly) | Medium to High (Daily or weekly use) | Medium (Open to paying for better tools) | Moderate churn (20-40%) → Some will upgrade, others will drop off | Good revenue growth if charged a fair amount (₹1000-₹2500/month) |
Power Users | High (Uses TradingView daily) | High (Multiple times per day) | High (TradingView is essential to workflow) | Low churn (5-10%) → They need premium features | Very High → Can be charged ₹2500-₹5000/month, maximizing LTV |
Action Plan Based on RFM Analysis
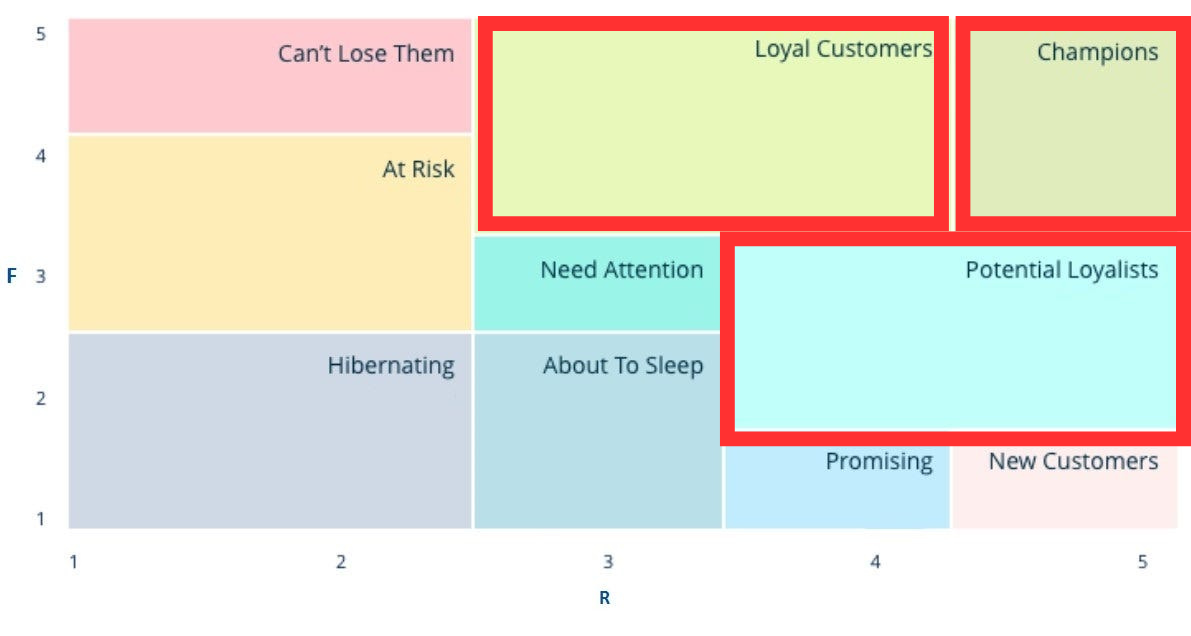
✅ Charge Champions & Loyal Customers first → They have the lowest churn and highest revenue potential.
✅ Convert Potential Loyalists into paid users → Use time-sensitive offers, premium trials, and feature limitations.
Key Takeaways for Who to Charge
- Don’t push monetization too early for Casual users → They need habit formation first before they’ll pay.
- Charge Core & Power users first → They are already experiencing deep value and need premium tools.
- From RFM Analysis best time to the upsell → High recency + frequency = highest likelihood of conversion. i.e. to first charge Champions & Loyal Customers first.
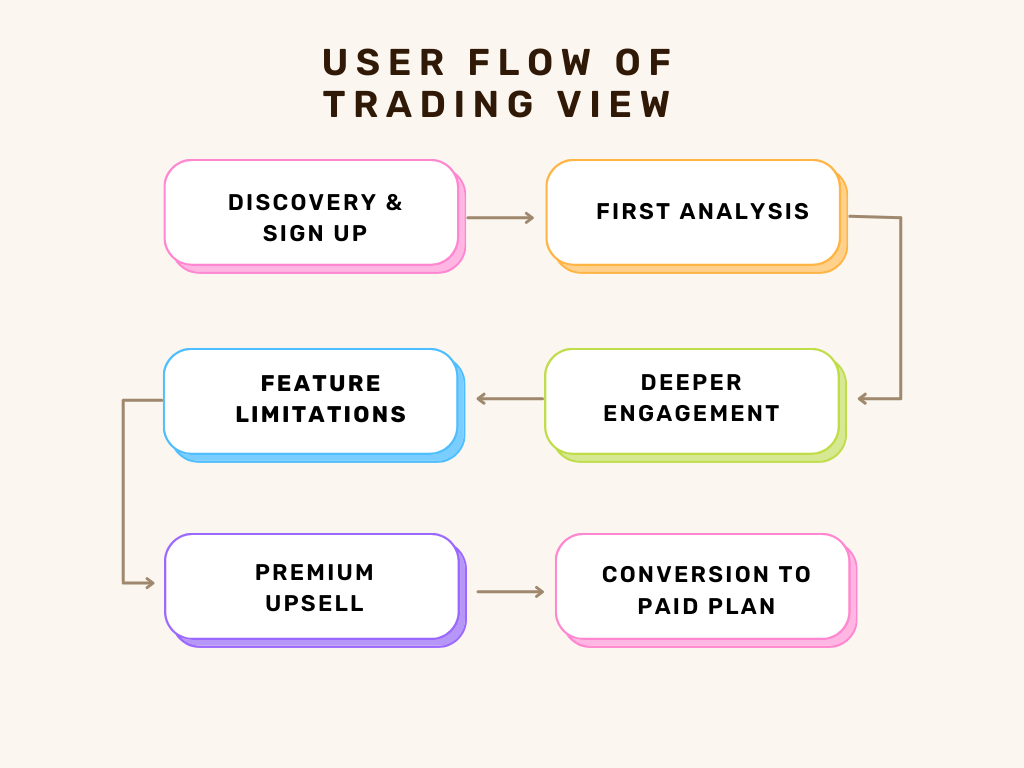
User Flow For TradingView
Before getting into Perceived Price Let's take a look at the user flow of TradingView?
- Discovery & Signup → User explores free features.
- First Analysis → Starts using charts, basic indicators, and timeframes.
- Deeper Engagement → Uses multiple assets, saves layouts, sets alerts.
- Feature Limitations → Hits a free-tier limit (e.g., max 3 indicators, no custom alerts).
- Premium Upsell → Prompted to upgrade for real-time data, unlimited alerts, advanced indicators.
- Conversion to Paid Plan → Users who see value in efficiency, automation, or profitability upgrade.
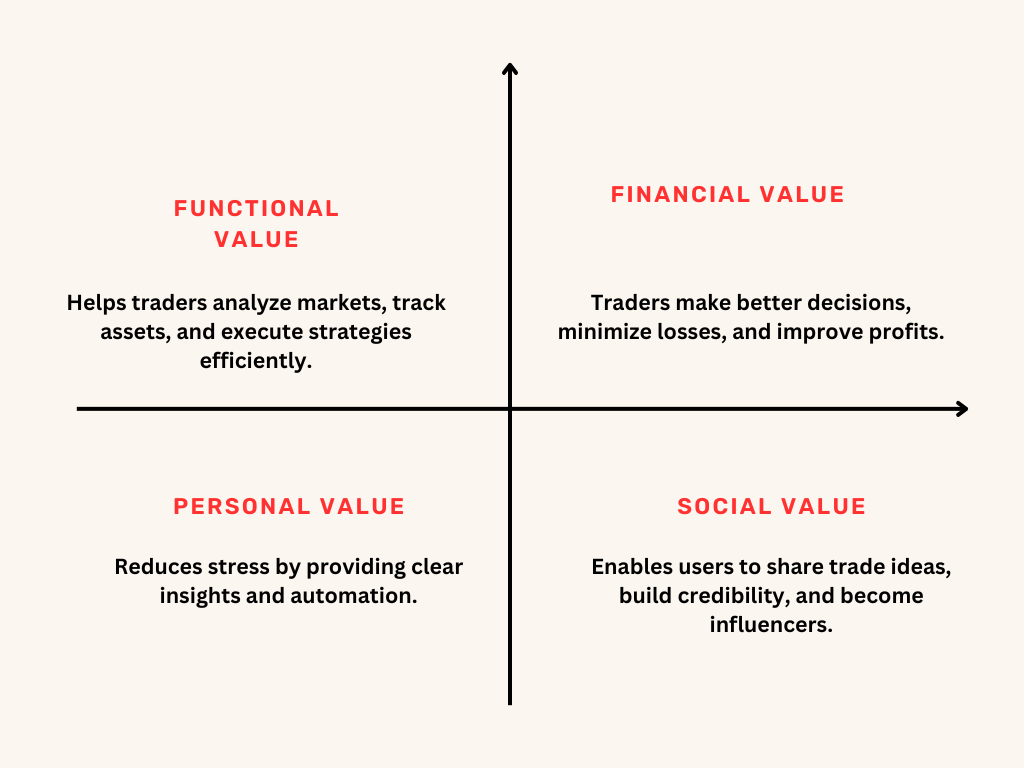
Perceived Value of TradingView
What type of perceived value does TradingView hold?
- Functional Value → Helps traders analyze markets, track assets, and execute strategies efficiently.
- Financial Value → Traders make better decisions, minimize losses, and improve profits.
- Personal Value → Reduces stress by providing clear insights and automation.
- Social Value → Enables users to share trade ideas, build credibility, and become influencers.
Deep Dive on Perceived Value
What is TradingView’s perceived value against competition?
- More intuitive and user-friendly than MetaTrader (MT4/MT5).
- Better visualization & technical tools compared to free broker charts (Zerodha, Upstox).
- Community-driven insights missing in Bloomberg, MetaTrader, or Investing.com.
Why does TradingView have an edge over competitors?
- Web-based, multi-device access (no complex software installation).
- Deep customization with Pine Script for automation.
- Cross-market tracking (stocks, forex, crypto, indices, commodities) in one platform.
- Social Trading Community that allows idea sharing, strategy validation, and mentorship.
How much benefit does TradingView offer in monetary gains?
- For traders, making one profitable trade due to a TradingView feature (alerts, indicators, data) can easily justify the cost.
- For professionals, it optimizes decision-making, making them more consistent and profitable.
- For educators & influencers, TradingView is a credibility-building tool that helps them monetize their knowledge.
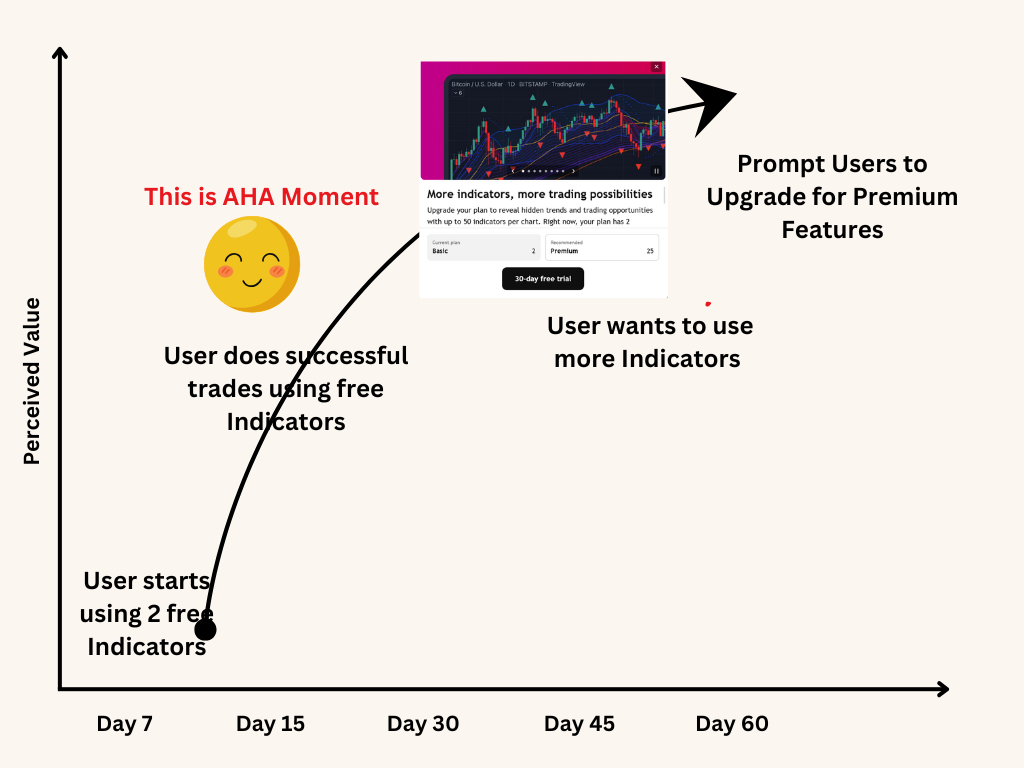
When in the user journey do users experience the product's perceived value?
- Power Users → Almost immediately (1-2 weeks).
- Core Users → When they hit free-tier limitations (1-2 months).
- Casual Users → Only after deep engagement (3+ months).
Perceived Price of TradingView
Users compare TradingView’s pricing against:
1️: Alternative solutions (MetaTrader, Bloomberg, Investing.com, free broker charts).
2️: Their own ROI (Return on Investment) → Will this tool help them make or save money?
3️: Feature limitations in the free version → Are the premium features essential for their trading success?
Perceived Price vs. Perceived Value: Breaking Down the Justification
| User Type | What They Think About Price? | How to Justify the Price? |
|---|---|---|
Casual Users (Free Users) | "I can use free broker charts, why should I pay?" | Offer one-time purchases for premium indicators & limited-time access to real-time data. |
Core Users (Swing & Intraday Traders) | "If TradingView helps me make better trades, it's worth it." | Emphasize time savings, better decision-making, and strategy automation |
Power Users (Professional Traders & Analysts) | "I need a reliable tool with no compromises." | Justify institutional-grade features, Pine Script automation, and API access as an investment, not a cost. |
How to Influence Perceived Price Positively?
- Framing the Cost as a Return on Investment (ROI)
- Creating Tiered Perceived Pricing
- Anchoring Perceived Price Against Expensive Alternatives
- Using Psychological Pricing Techniques
Determining the Point of Monetization
Charge users when:
✅ Perceived Value > Perceived Price.
✅ The user has hit a limitation in the free tier that directly impacts their trading workflow.
✅ Time Spent & Engagement Levels Indicate Dependency (Frequent logins, saved layouts, active alerts).
⏳ Inflection Point = Perceived Value + Time > Perceived Price
- This happens sooner for Power Users & Core Users → They should be monetized early.
- Casual Users should stay in freemium longer to build habit formation.
Key Takeaway:
✔ Don’t charge too early—let users experience perceived value first.
✔ Power users will convert fastest, core users need nudges, and casuals need habit formation.
✔ Use free-tier limitations as a natural upsell point to monetize effectively.
Discovery of Pricing Model
Users can discover TradingView's pricing information through various sections and interactions on the platform:
- Dedicated Pricing Page:
- Accessible via the main navigation menu, the Pricing page offers a detailed comparison of available subscription plans and their respective features.
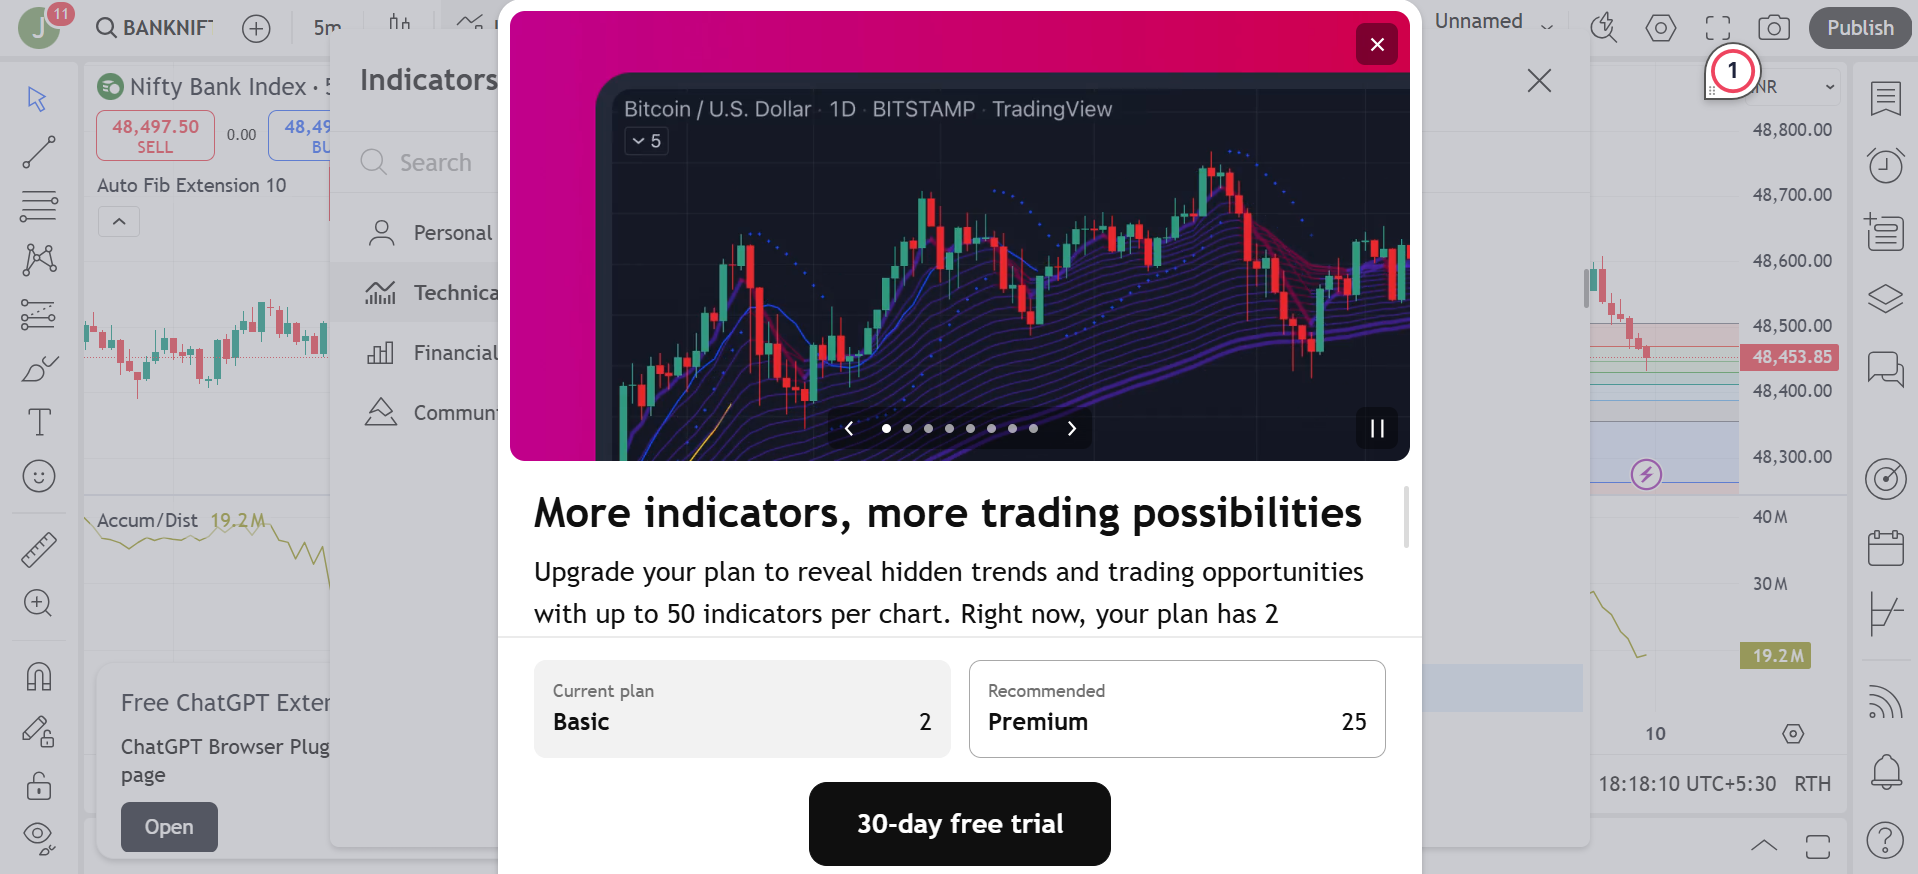
- Upgrade Prompts During Feature Access:
- When free users attempt to utilize premium features—such as adding more indicators, accessing real-time data, or setting additional alerts—they encounter prompts informing them of the feature's availability in higher-tier plans, accompanied by options to upgrade.
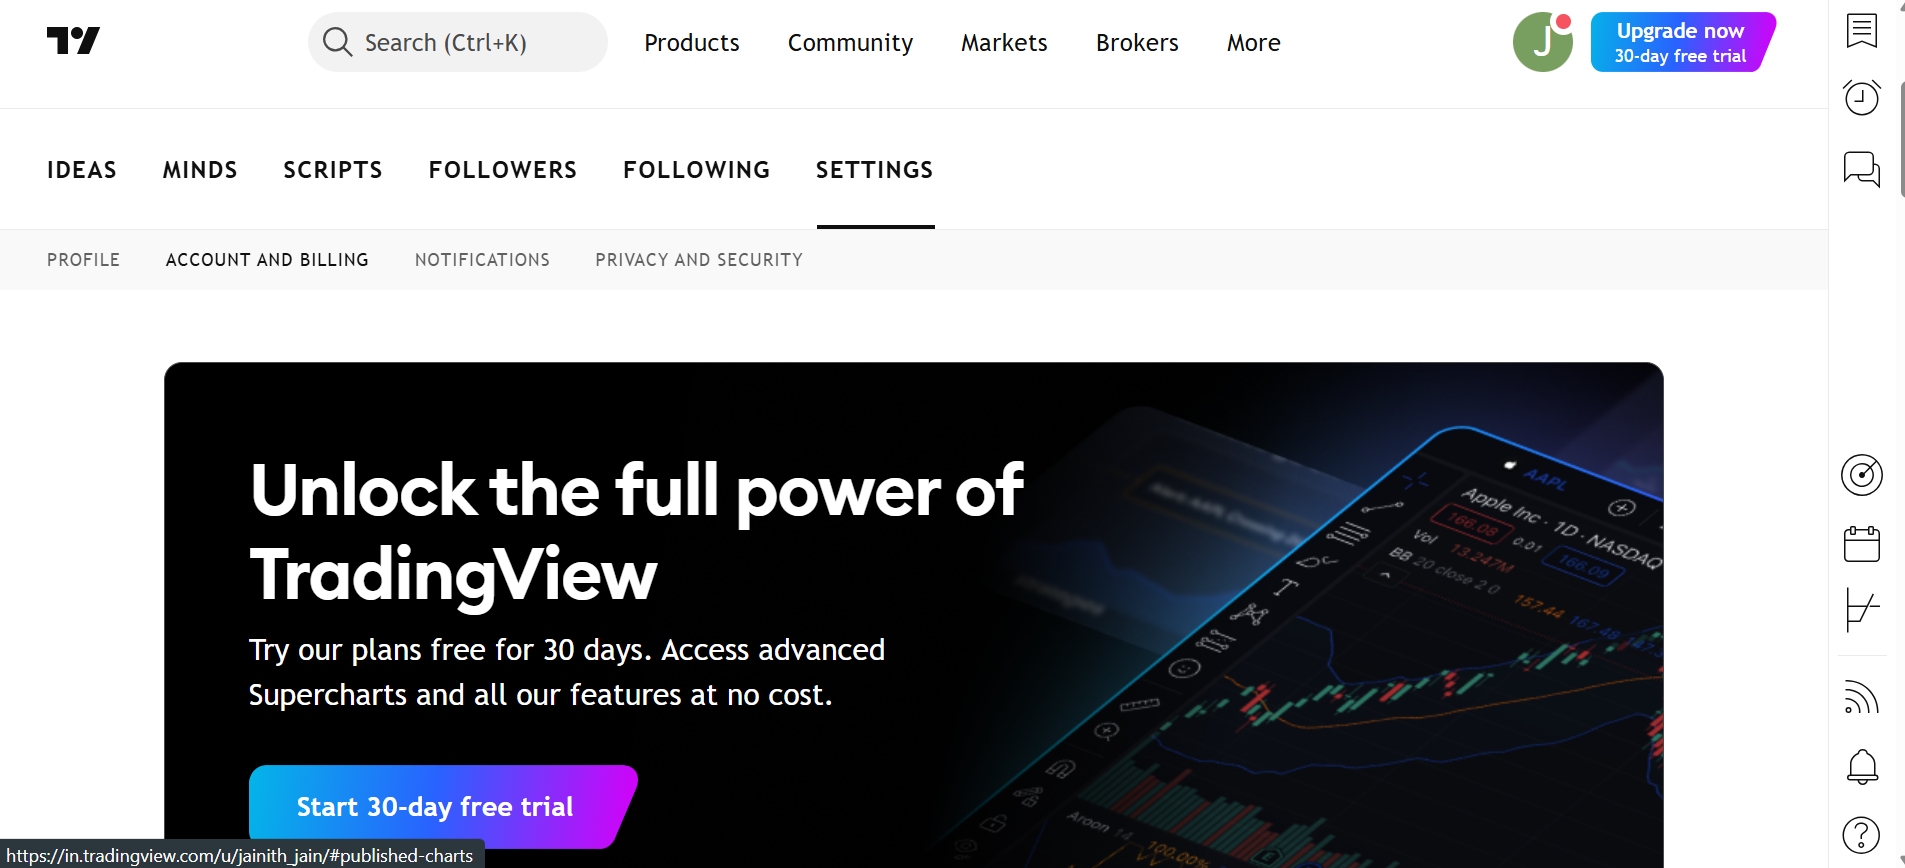
- User Account Settings:
- Within the account settings or profile section, users can view their current subscription status and explore options to upgrade or modify their plans.
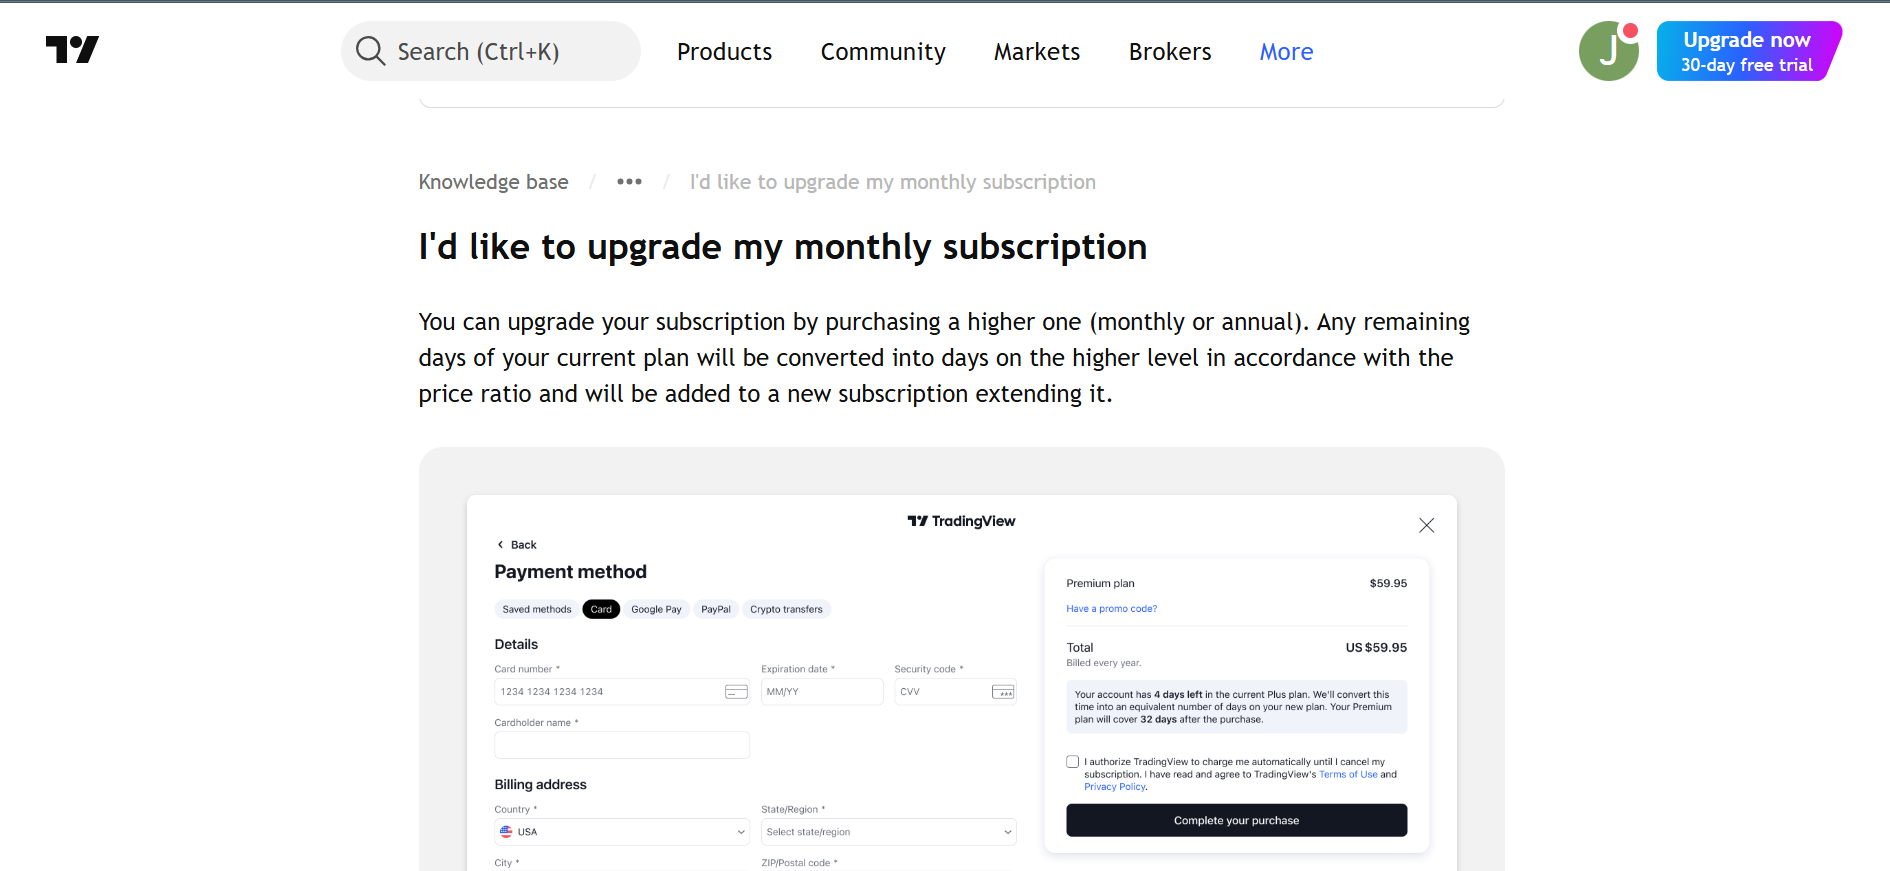
- Support and FAQ Sections:
- The Support Center provides articles detailing the differences between subscription plans, guiding users on selecting the most suitable option.
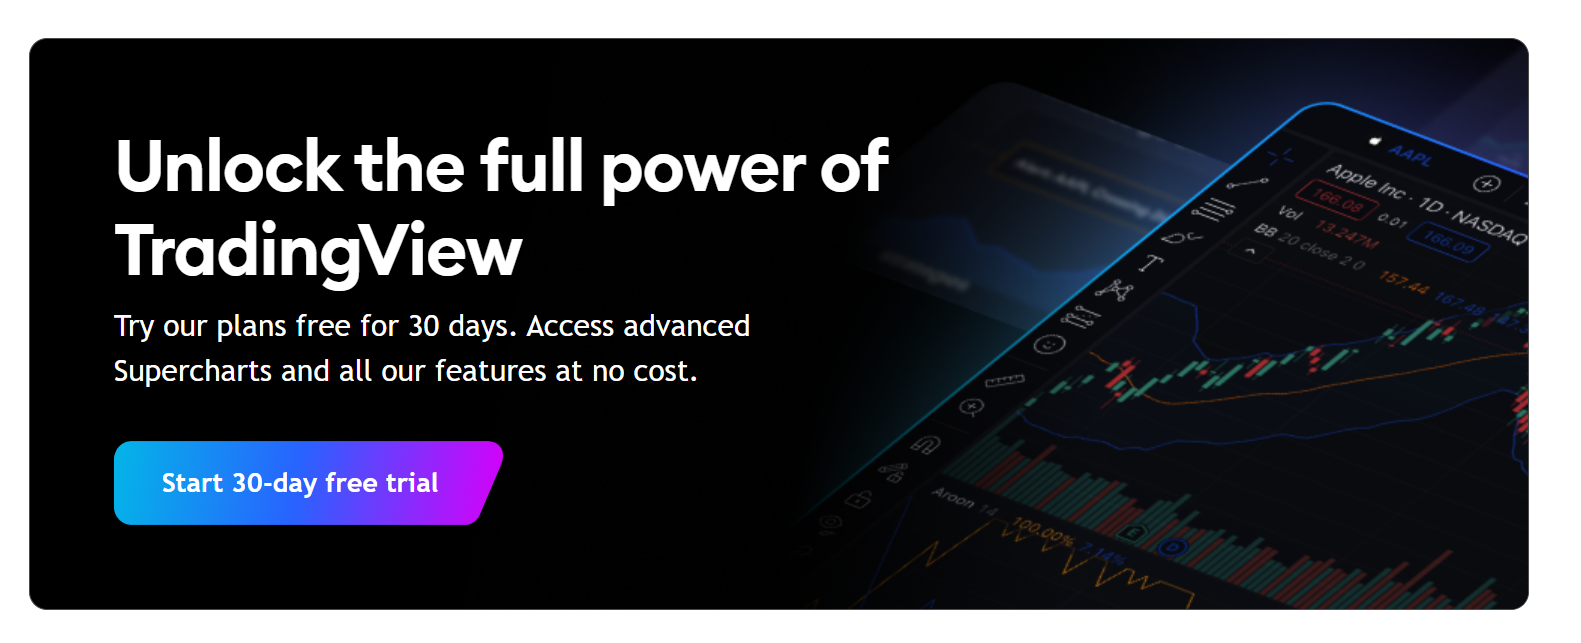
- Marketing Banners and Notifications:
- Occasionally, TradingView displays banners or notifications highlighting promotional offers or discounts on subscription plans, encouraging users to consider upgrading.
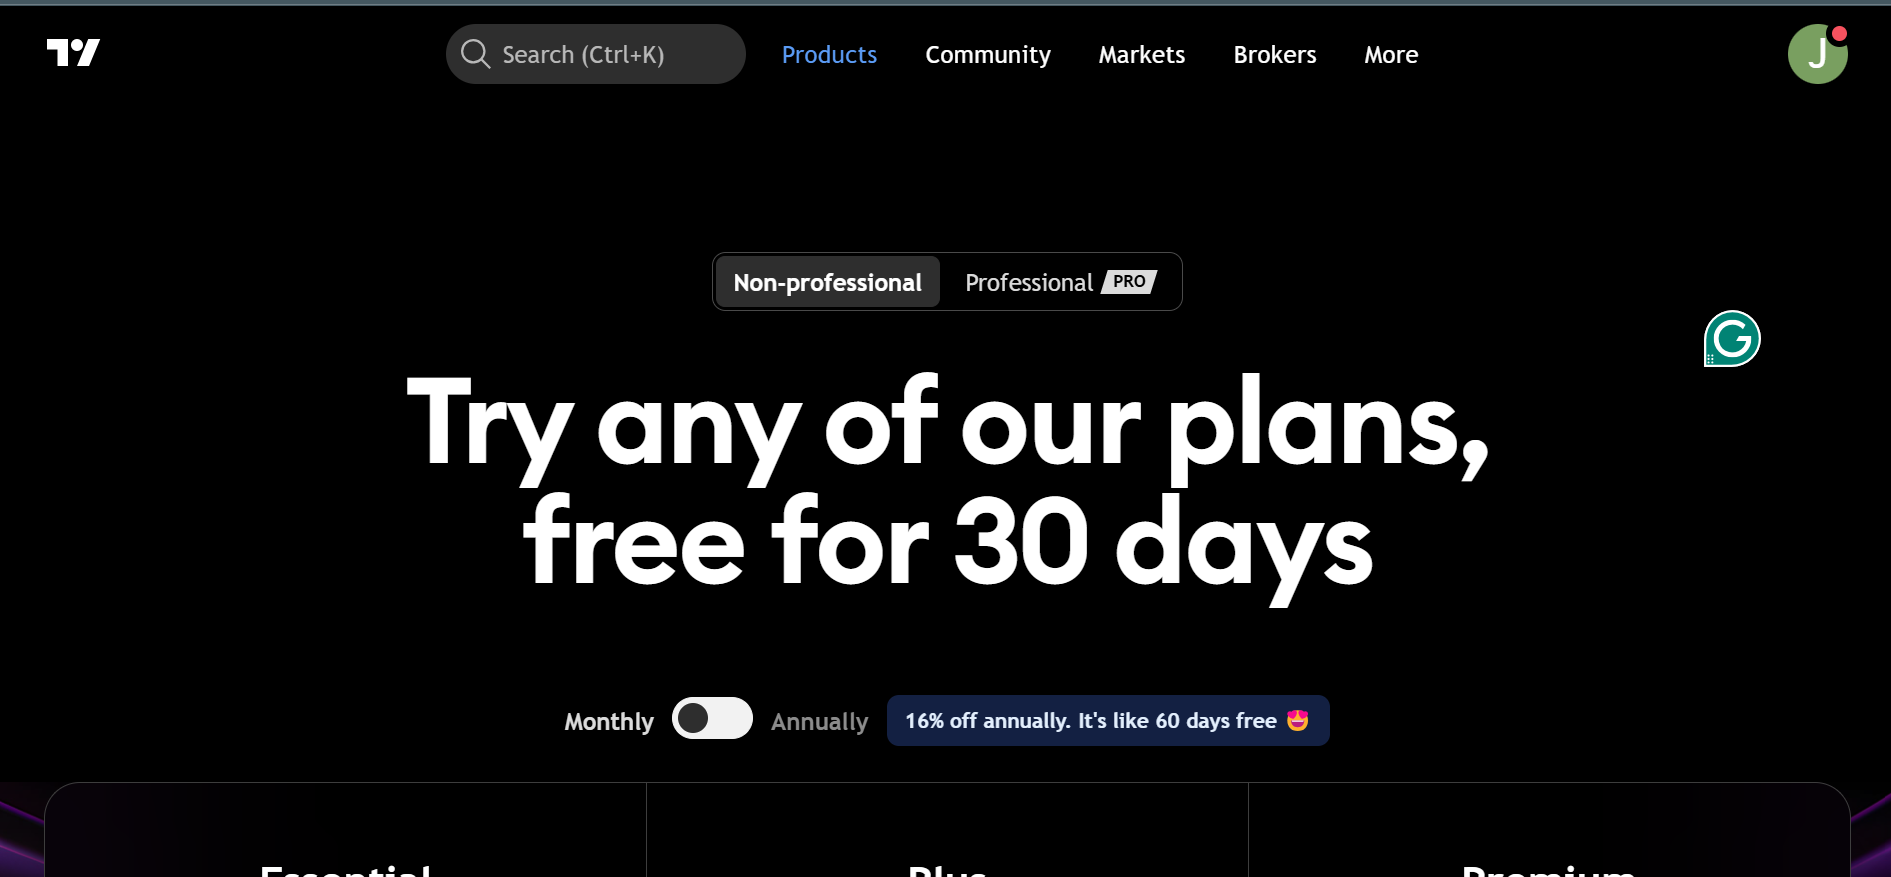
Pricing Page Teardown
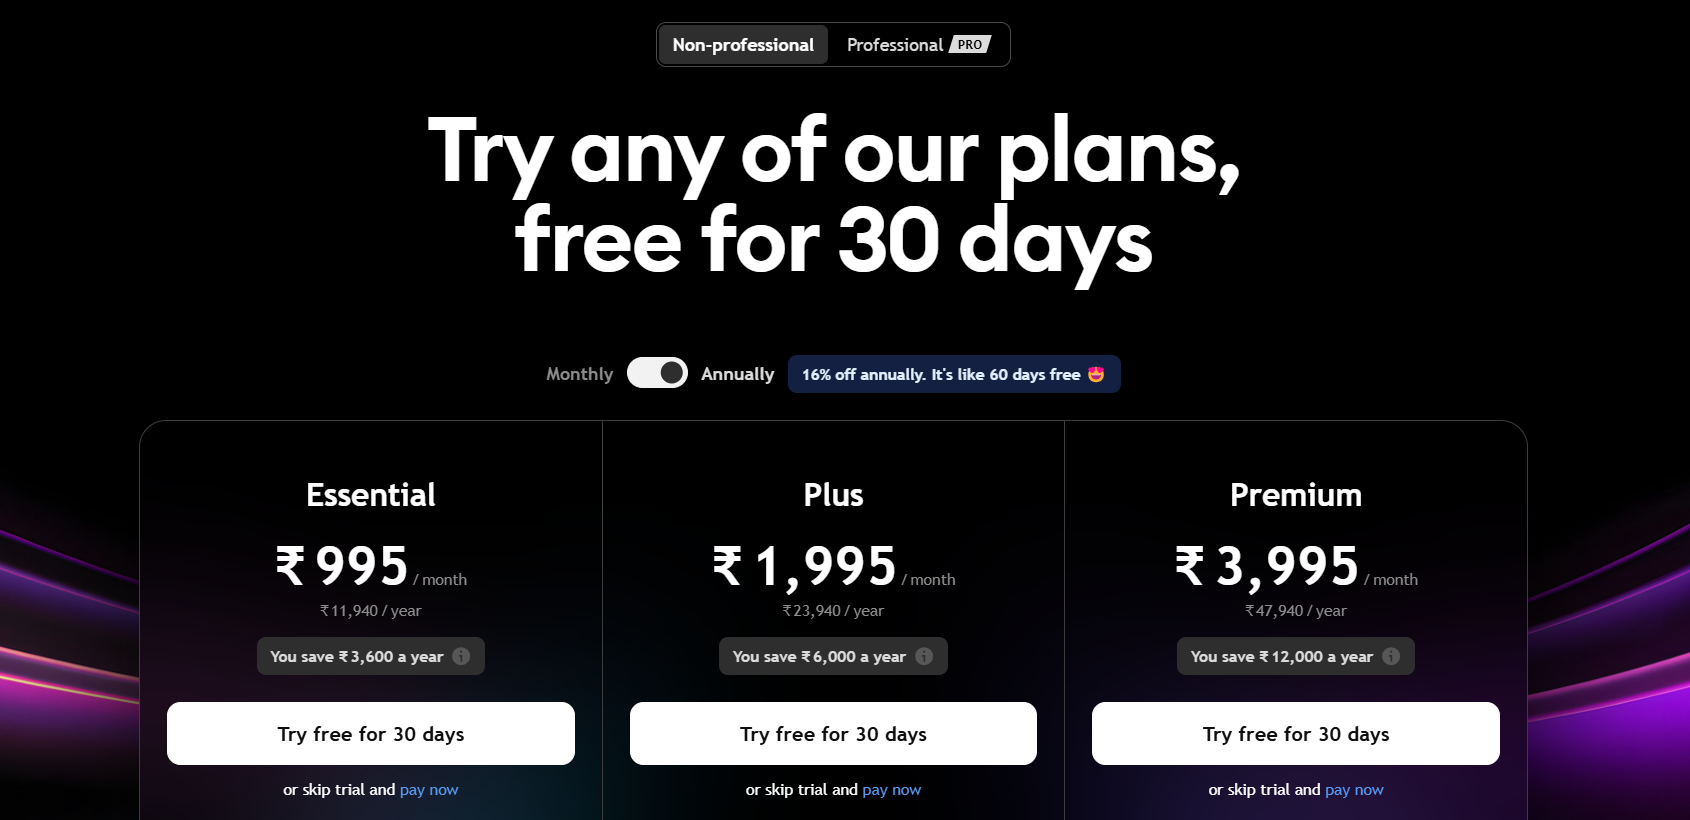
Does it have 3 Pricing Strategy? - Yes
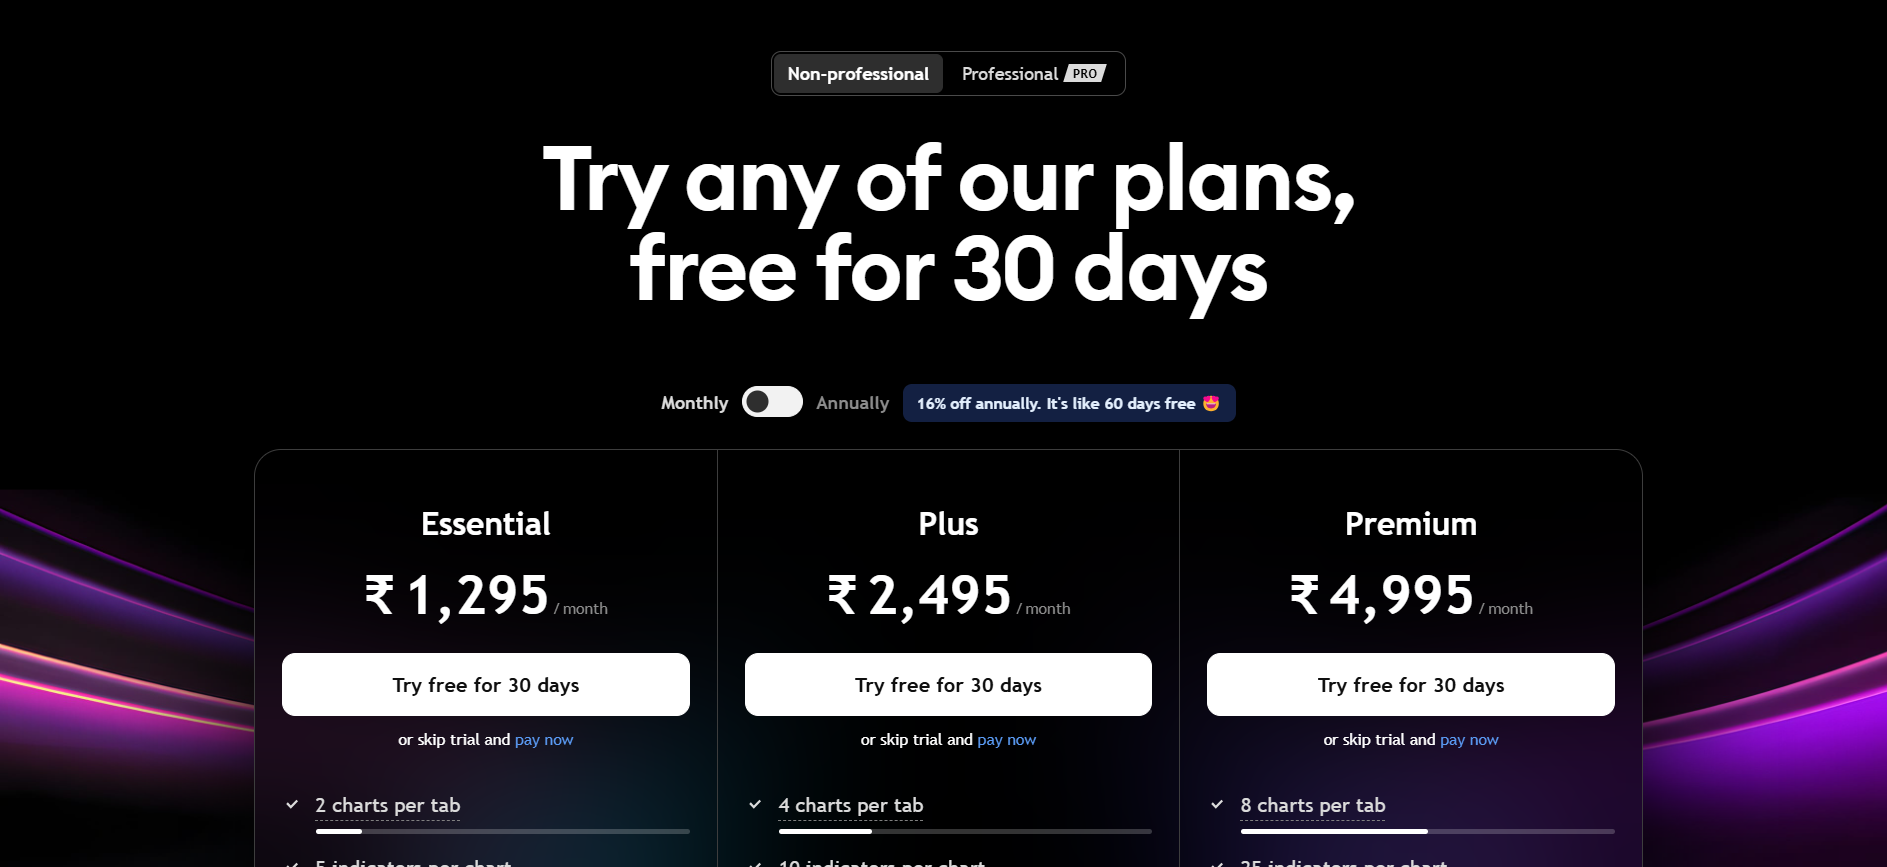
Does it have Scratching Effect? - No it doesn't have scratching effect but if does offer additional discount on Annual Plans and highlights the amount saved.
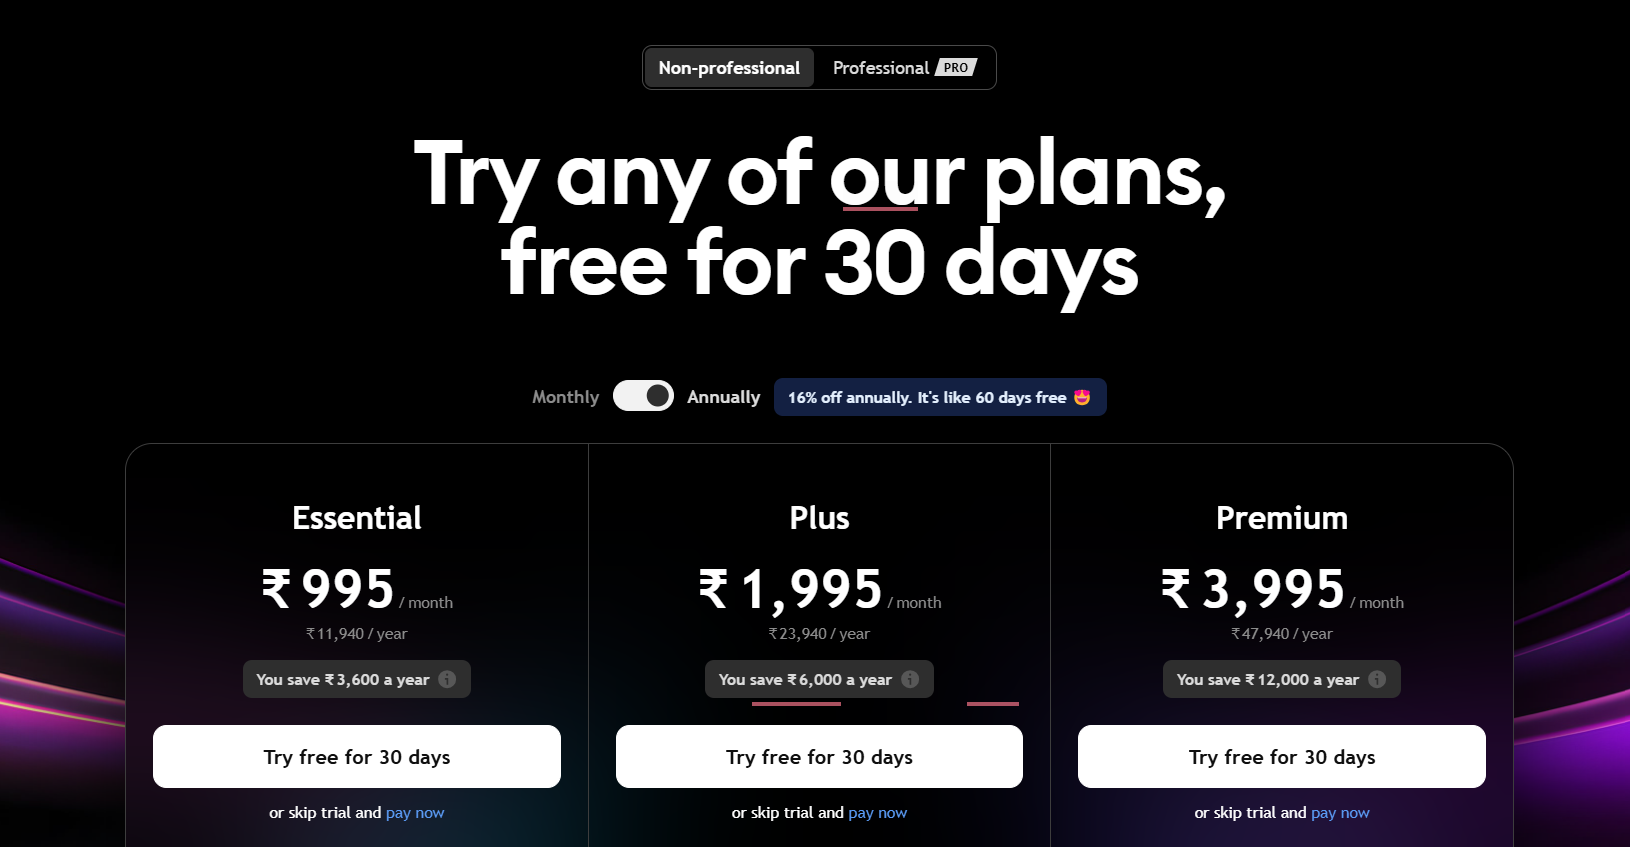
Does it have Ownership Effect? - Yes, users can try any plan for 30days
Does it have Price Anchoring? - Yes, users can compare on the basis of features.
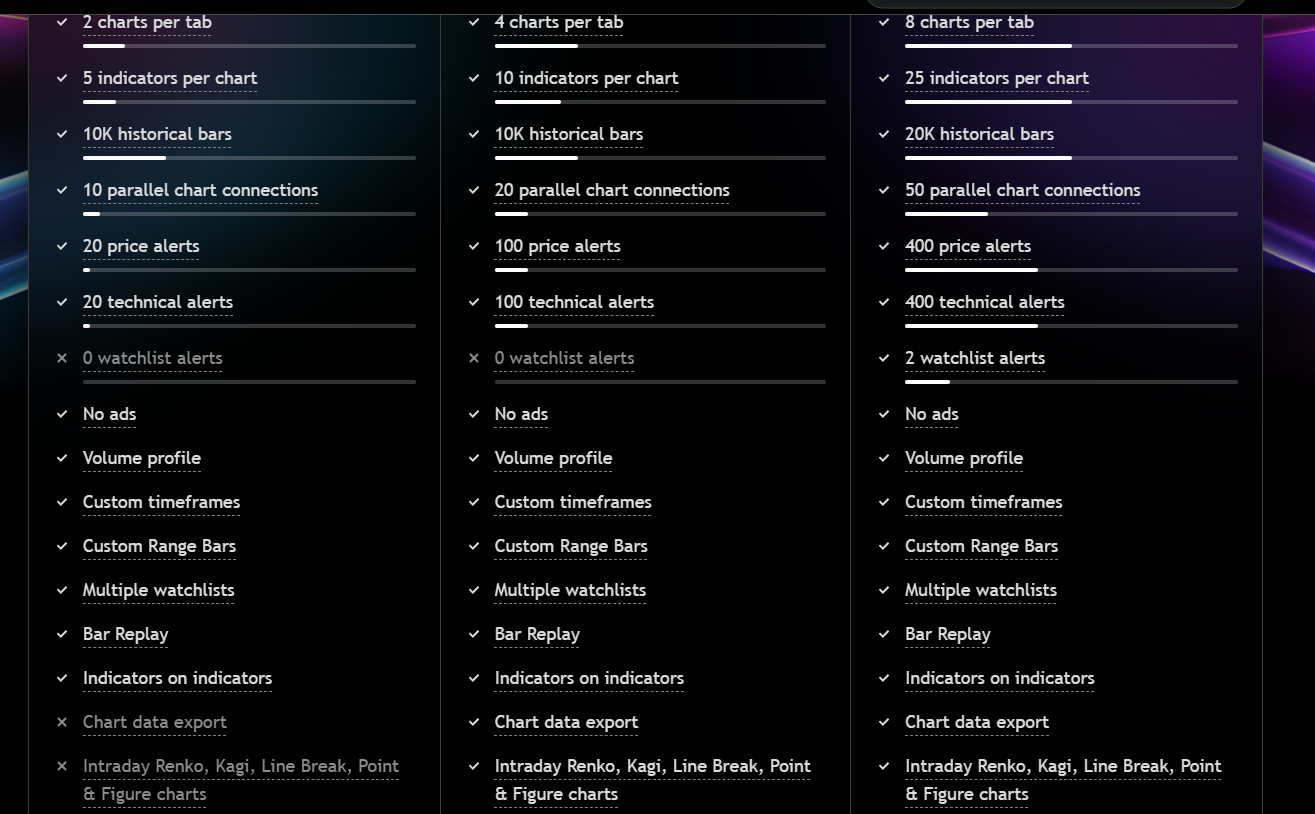
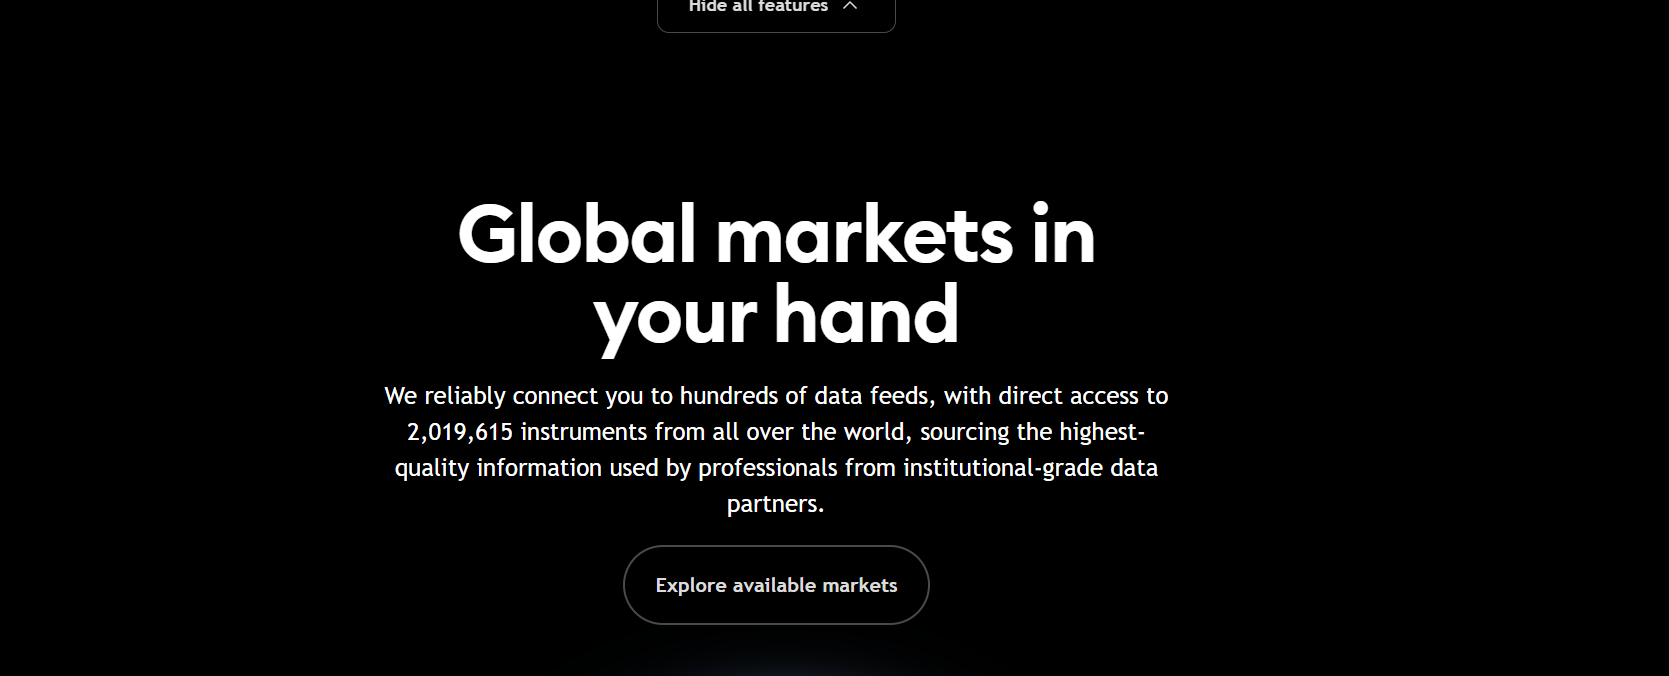
Surround Effect or Bundling? - Yes, TradingView Not just provides one market, but different global markets data
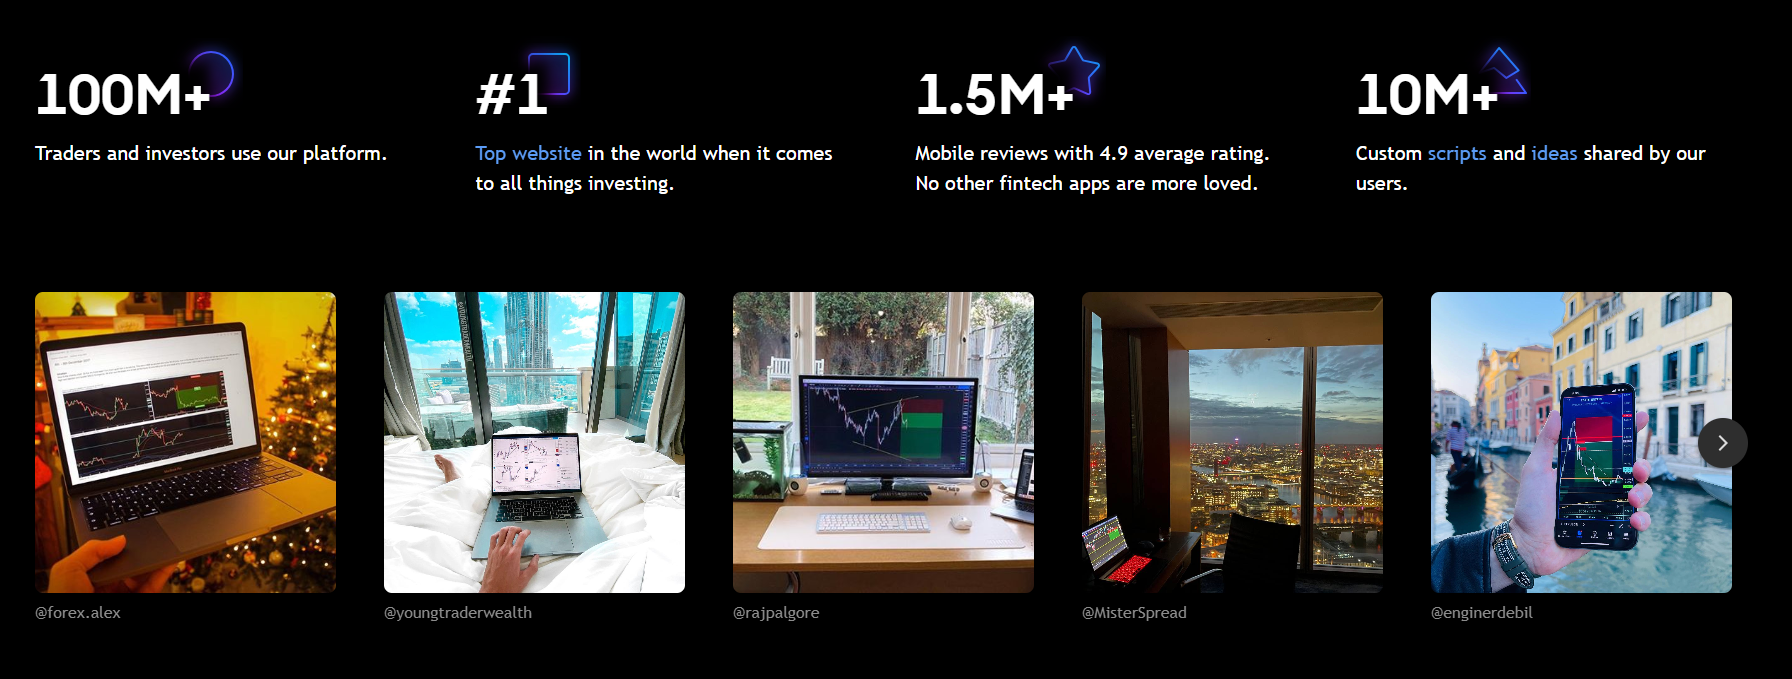
Borrowing Trust Effect? - Yes, it does show Social proofing numbers and also snips of professional traders (influencers) using TradingView
System Design? - System 2 Design
- Trading is a highly analytical activity that requires detailed decision-making.
- Users spend time analyzing charts, indicators, and strategies before making a trade.
- Many traders rely on custom scripts, backtesting, and deep data analysis, which require cognitive effort and logical reasoning.
- Users often subscribe to premium features (real-time data, advanced alerts, backtesting) only after evaluating the cost-benefit ratio → a deliberate System 2 decision.
However, System 1 Also Plays a Role
While most of TradingView's core engagement relies on System 2 thinking, certain elements trigger fast, emotional decision-making (System 1):
- FOMO (Fear of Missing Out) → When traders see a price movement, they might impulsively act.
- Community Influence → Users quickly follow trade ideas based on crowd sentiment.
- Instant Alerts → Traders get real-time push notifications, triggering immediate decisions.
- Premium Upsells in the Moment of Need → When a free user tries to set a 4th alert and gets blocked, they may impulsively upgrade to Pro.
Final Conclusion: TradingView Is Primarily System 2, But Can Leverage System 1 for Monetization
- System 2 → Core product engagement (charts, indicators, backtesting).
- System 1 → Real-time decision triggers (alerts, community, urgent upsells).
Brand focused courses
Great brands aren't built on clicks. They're built on trust. Craft narratives that resonate, campaigns that stand out, and brands that last.


All courses
Master every lever of growth — from acquisition to retention, data to events. Pick a course, go deep, and apply it to your business right away.


Explore courses by GrowthX
Built by Leaders From Amazon, CRED, Zepto, Hindustan Unilever, Flipkart, paytm & more
Course
Advanced Growth Strategy
Core principles to distribution, user onboarding, retention & monetisation.
58 modules
21 hours
Course
Brand Led Growth
Design your brand wedge & implement it across every customer touchpoint.
15 modules
2 hours
Course
Creative Strategy
Build a solid creative strategy that fuels brand growth and drives real, measurable business impact.
10 modules
2 hours
Course
Storytelling
Learn the art & science of crafting stories that create emotional connect and drive business impact
12 modules
2 hours
Course
Data Led Growth
Learn the science of RCA & experimentation design to drive real revenue impact.
12 modules
2 hours
Course
Event Led Growth
Design an end to end strategy to create events that drive revenue growth.
48 modules
1 hour
Course
Partnership Led Growth
Design product integrations & channel partnerships to drive revenue impact.
27 modules
1 hour
Course
Tech for Growth
Learn to ship better products with engineering & take informed trade-offs.
14 modules
2 hours
Course
Growth Model Design
Learn how to break down your North Star metric into actionable input levers and prioritise them.
9 modules
1 hour
Course
Building Growth Teams
Learn how to design your team blueprint, attract, hire & retain great talent
24 modules
1 hour
Crack a new job or a promotion with ELEVATE
Designed for mid-senior & leadership roles across growth, product, marketing, strategy & business


Learning Resources
Browse 500+ case studies, articles & resources the learning resources that you won't find on the internet.

Patience—you’re about to be impressed.